Water quality monitoring
Monitoring Program Overview
The water quality monitoring program supports the District's 10-year Watershed Management Plan to remove waterbodies from the Impaired Waters list maintained by the Minnesota Pollution Control Agency (MPCA). Data collected during the field season (April to September) helps determine sources of water quality impairments and provides information needed to design and install improvement projects.
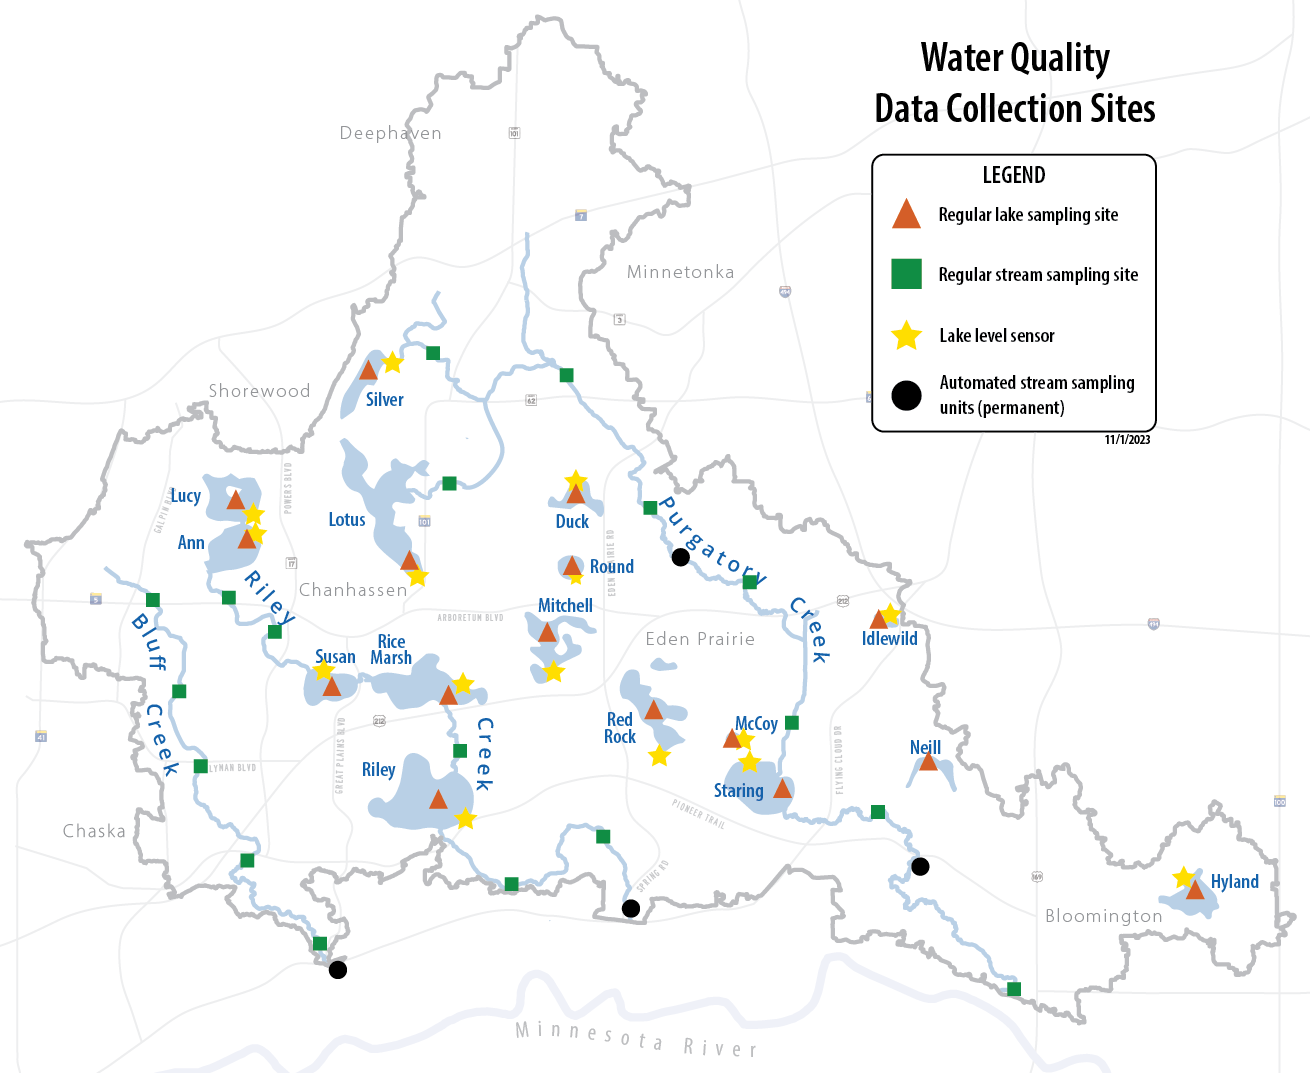
Water samples from lakes and creeks are collected manually and by automated sampling units. In-lake and in-stream sensors collect continuous data. In addition to regular monitoring sites, some locations are monitored on a rotational or as-needed basis due to project planning needs.
MOnitoring Reports
- Annual reporting - Read the latest and previous water quality report.
- Lakes and creeks - Find information about each major waterbody.
- Waterbody fact sheets - View a fact sheet about each major waterbody including water quality data summaries.
Learn about lake grades and what they mean.
Stream Monitoring
The District monitors streams for six impairment categories defined by the MPCA. When a measured value does not meet the standard, the stream is designated as impaired for the category. Click the links below to learn more about monitoring results of each stream.
Stream Restoration
RPBCWD developed the Creek Restoration Action Stategy (CRAS) to prioritize stabilization or restoration projects for creek reaches or subreaches. Eight categories are used to prioritize projects:
- Infrastructure risk
- Erosion and channel stability
- Public education
- Ecological benefits
- Water quality
- Project cost
- Partnerships
- Watershed benefits
Scoring methods in these categories were based on a combination of published studies and reports, erosion inventories, field visits, and other existing scoring methodologies. Individual sections (reaches and subreaches) of creeks are scored. Based upon their scores in the eight categories, creek sections are rated as low, moderate, high, or severe priority for restoration.
Lake Monitoring
Thirteen lakes are regularly monitored within the watershed district. Data collected is used to track water quality trends over time and to determine if a lake is meeting water quality standards set by the MPCA. Four lakes in RPBCWD (Ann, Lotus, Riley, and Round) are considered "Deep Lakes" and are compared to the deep lake water quality standards, which are stricter than the standards set for shallow lakes. See the table below for MPCA standards for phosphorus, chlorophyll-a, and water clarity.
| Water Quality Parameter | MPCA Standard for "Deep Lakes" | MPCA Standard for "Shallow Lakes" |
|---|---|---|
| Total Phosphorus | Less than 0.040 milligrams/liter | Less than 0.060 milligrams/liter |
| Chlorophyll-a | Less than 14 micrograms/liter | Less than 20 micrograms/liter |
| Water Clarity | Greater than 1.4 meters | Greater than 1.0 meter |
To see monitoring trends for each lake, visit the waterbodies page.
Do you live on a lake?
You may need a permit to do work near the shoreline. Visit the Shoreline Permit page.
Wetland Monitoring
RPBCWD staff assess wetlands using the Minnesota Routine Assessment Method (MnRAM) as well as a modified version of the Rapid Floristic Quality Assessment (Rapid FQA). Information collected with these methods form the basis of wetland restoration prioritization in the District. The use of MnRAM also provides support for the RPBCWD regulatory program and implementation of the Minnesota Wetland Conservation Act (WCA), where the District is the local governement regulating body for Deephaven and Shorewood.
Wetlands are classified as low, medium, high, or exceptional value. These classifications are based on these functional categories:
- Vegetation diversity/integrity
- Habitat structure
- Amphibian habitat
- Fish habitat
- Shoreline protection
- Cultural/recreational/educational value
- Stormwater/urban sensitivity
- Wetland water quality
- Characteristic hydrology
- Flood/stormwater attenutation
- Commercial use
- Downstream water quality
Learn more about wetlands in the RPBCWD Annual Report.
Live next to a wetland?
Learn about the benefits of a wetland buffer.
Water Quality Monitoring Stations
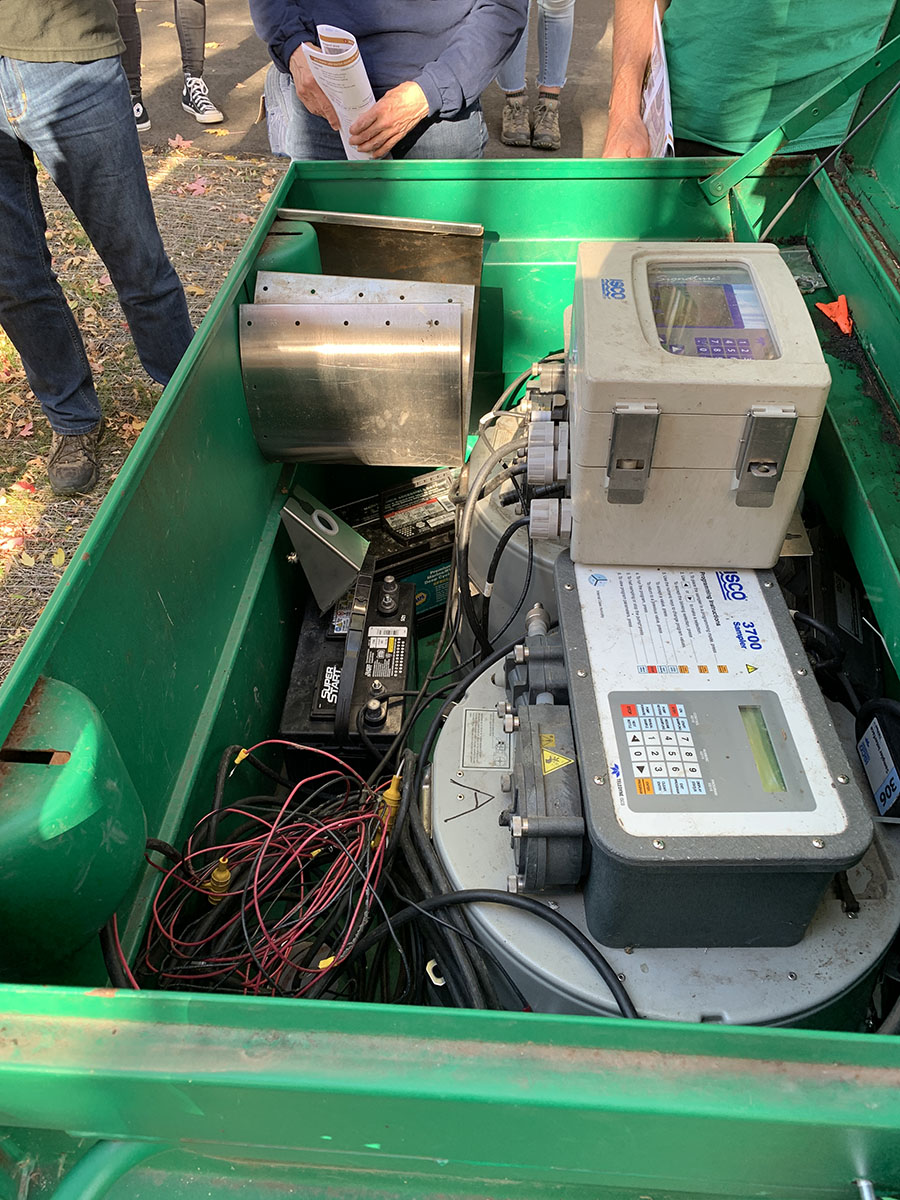 Staff at RPBCWD place water quality monitoring stations throughout the district. The monitoring equipment is housed inside heavy duty metal or plastic boxes and includes sensors that collect data on water flow, temperature, level, and other metrics. Some of these stations also automatically collect water samples after a rain event.
The data collected is combined with other information to assess the health of water resources including streams, lakes, and wetlands. Often, the monitoring stations are placed before and after a water quality improvement project installation to measure project effectiveness.
The photo shows a monitoring station installed in late 2022 in the park north of Rice Marsh Lake. The station monitors a water quality improvement project finished that same year.
Monitoring by Others
These organizations also collect and/or analyze water quality data:
Data sources
RPBCWD staff collect water quality data throughout the year. Some of this raw data is available immediately on the Monitor My Watershed website. Other data is sent at the end of the year to state agencies. Water quality summaries are prepared by district staff at the end of the year.
Staff also use trusted external data sources to supplement reports. Precipitation data is pulled from NOAA, and nearby invasive species reports are reviewed in the EDDMaps to see what potential threats exist.
Monitor My Watershed
Browse water quality data uploaded by multiple organizations, including Riley Purgatory Bluff Creek Watershed District. NOTE: Data from RPBCWD is auto-uploaded by EnviroDIY units. The raw data has not been reviewed/corrected. For final info, see the district's Water Quality Report. Also, RPBCWD uses EnviroDIY units on some but not all waterbodies, so this site does not include all collected data.
Click to openDNR Lake Finder
Search for a lake by name and/or county to have access to data such as water clarity, lake depth, water levels, lake health, public access sites, fish surveys, and fish stocking information.
Click to openMPCA Surface Water Database
The Minnesota Pollution Control Agency (MPCA) tracks water quality of surface waters (lakes and streams). Search for waterbodies by location, impairments, or assessments. You can also use their webmap to zoom in on an area of interest or search by address.
Click to openNOAA Daily Precipitation
The National Oceanic and Atmospheric Administration tracks precipitation throughout the country. RPBCWD uses NOAA precipitation data (GHCN Daily) from stations in Chanhassen and Flying Cloud Airport in water quality monitoring reports. With this online map, users may also pull data from CoCoRaHS (volunteer precipitation reporting) for rainfall data at the neighborhood level.
Click to openEDDMapS Invasive Species
The Early Detection and Distribution Mapping System (EDDMapS) provides real-time tracking of invasive species and pests. This national database includes aquatic and terrestrial plants and animals. EDDMapS data is contributed by knowledgeable volunteers and also aggregated from other databases and organizations such as the MnDNR. RPBCWD uses this site to stay informed of invasive species reports in the area.
Click to open