Water Quality
Let's talk about lake health!
The RPBCWD staff is out on the water year-round monitoring the quality of our lakes and creeks. Have you ever wondered what exactly they're doing out there? Are you curious about how they interpret their findings? Let's find out!
Water Quality Standards
In 1974, the Federal Clean Water Act set forth the requirements for states to develop water quality standards for surface waters. In Minnesota, the agency in charge of regulating water quality is the Minnesota Pollution Control Agency (MPCA). Water quality monitoring and reporting is a priority for the District to determine the overall health of the water bodies within the watershed boundaries. The District’s main objectives are to prevent a decline in the overall water quality within lakes and streams and to prevent water bodies from being added to the 303d Impaired Water Bodies list (MPCA). The District is also charged with the responsibility to take appropriate actions to improve the water quality in water bodies that are currently listed for impairments.

There are seven ecoregions within Minnesota; the RPBCWD is within the Northern Central Hardwood Forest (NCHF) ecoregion. Rural areas in the NCHF are dominated by agricultural land and fertile soils. For most water resources in the region, phosphorus is the limiting (least available) nutrient within lakes and streams, meaning that the available concentration of phosphorus often controls the extent of algal growth. The accumulation of excess nutrients (i.e., TP and Chl-a) in a waterbody is called eutrophication. This relationship has a direct impact on the clarity and recreational potential of our lakes and streams. Water bodies with high phosphorus concentrations and increased levels of algal production have reduced water clarity and limited recreational potential.
All lakes sampled in the District are considered Class 2B surface waters. The MPCA states that this class of surface waters should support the propagation and maintenance of a healthy community of cool or warm water sport or commercial fish and associated aquatic life, and their habitats. They should also be suitable for aquatic recreation of all kinds, including bathing. This class of surface water is not protected as a source of drinking water.
water quality indicators
Here are some of the things our staff measure when they're out in the field. Each one tells us something different about the health of our waters.
Phosphorus
A majority of the phosphorus in our waters comes from agricultural or urban run-off. Phosphorus is a major component of the fertilizers used to grow crops, and is found naturally in grass clippings, leaves, and other organic matter that wash into our storm drains or directly into our lakes. Without BMPs in place to intercept and filter the nutrients out of the water, the phosphorus makes its way into our lakes and streams where it negatively impacts our water quality.
Chlorophyll-a
Chlorophyll-a is the main pigment in algae, and is useful for measuring the concentration of algae present in a lake. Measurements are taken from water samples collected by a Van Dorn, an open-ended tube that allows you to capture water samples from a specific depth by lowering it and triggering the closure of the end plugs. Chlorophyll-a levels are a good indicator of the trophic level of a waterbody.
Dissolved Oxygen
Dissolved oxygen (DO) is a measure of the amount of oxygen present in the water. Oxygen is added to lakes through wind action and photosynthesis by phytoplankton and aquatic plants, and can be depleted during decomposition of organic material. As all aquatic life needs oxygen to survive, monitoring a waterbody's dissolved oxygen levels is a great way to evaluate the health of a lake through its ability to support aquatic life.
Water Clarity
Secchi disks are used to measure water clarity. It is calculated by lowering the disk into the water and marking the depth at which the disk disappears from view, reeling it back and marking the depth it reappears, and averaging the 2 numbers. A lake with good water clarity means sunlight can travel further down the water column, where it will be made available to aquatic life.
Chloride
Increasing chloride levels in water bodies are becoming of greater concern within the state of Minnesota. It takes only one teaspoon of road salt to permanently pollute five gallons of water, as chlorides do not break down over time. At high concentrations, chloride can be harmful to fish, aquatic plants, and other aquatic organisms.
Suspended Solids
TSS, or Total Suspended Solids, is a measure of the amount of particulate (soil particles, algae, etc.) in the water. Sources contributing TSS can include streambank and bluff erosion, as well as poorly vegetated ravines and gullies. Increased levels of TSS can be associated with many negative effects including nutrient transport, reduced aesthetic value, reduced aquatic biota, and decreased water clarity.
Nitrogen
The toxicity of nitrates to aquatic organisms has been a growing concern in MN over the last decade. Nitrate (NO3), the most available form of nitrogen for use by plants, can accumulate in lakes and streams since aquatic plant growth is not limited by its abundance. While nitrate has not been found to directly contribute to eutrophication of surface waters (phosphorus is the main cause of eutrophication) and is not an MPCA water quality standard, studies have found that nitrate can cause toxicity in aquatic organisms.
Zooplankton and Phytoplankton
Phytoplankton and zooplankton are the base of the food chain in freshwater systems, and populations fluctuate throughout the year. By ensuring that the lower parts of the food chain are healthy, we can protect the higher ordered organisms such as macroinvertebrates and fish. Zooplankton monitoring also helps us detect for invasive water fleas, which outcompete native zooplankton and are unavailable as a food source for fish due to their large spines.
2021 Lake Water Quality Summary
Chlorophyll-a, Total Phosphorus and Secchi Disk depth
The MPCA has specific standards for both ‘deep’ lakes and ‘shallow’ lakes. On the map to the right, summer growing season (June-September) averages of these parameters for each lake are compared to the MPCA standards to determine the overall state of the lake. The standards are set in place to address issues of eutrophication (excess nutrients) in local water bodies. If resulting values from our sampling are greater than the MPCA standards, the lake is considered impaired.
Note: Secchi disk readings are collected to measure the transparency (visibility) in each lake. A higher individual reading corresponds to increased clarity within the lake (this indicates the Secchi Disk was visible at a deeper depth in the water column).
Chloride
The MPCA Chloride Chronic Standard for our lakes (class 2B surface waters) is 230 mg/L, which is the highest concentration of chloride to which aquatic life, humans, or wildlife can be indefinitely exposed without causing chronic toxicity. The MPCA Chloride Maximum Standard is 860 mg/L, which is the highest concentration of chloride in water to which aquatic organisms can be exposed for a brief time with zero to slight mortality. The District has been monitoring chloride concentrations in our lakes and ponds since 2013 and will continue monitoring efforts to identify high salt concentration areas and to assess temporal changes in salt concentrations. Overall, chloride levels were below the MPCA water quality standard and have stayed relatively consistent within lakes year-to-year. Learn more about our Chloride Monitoring.
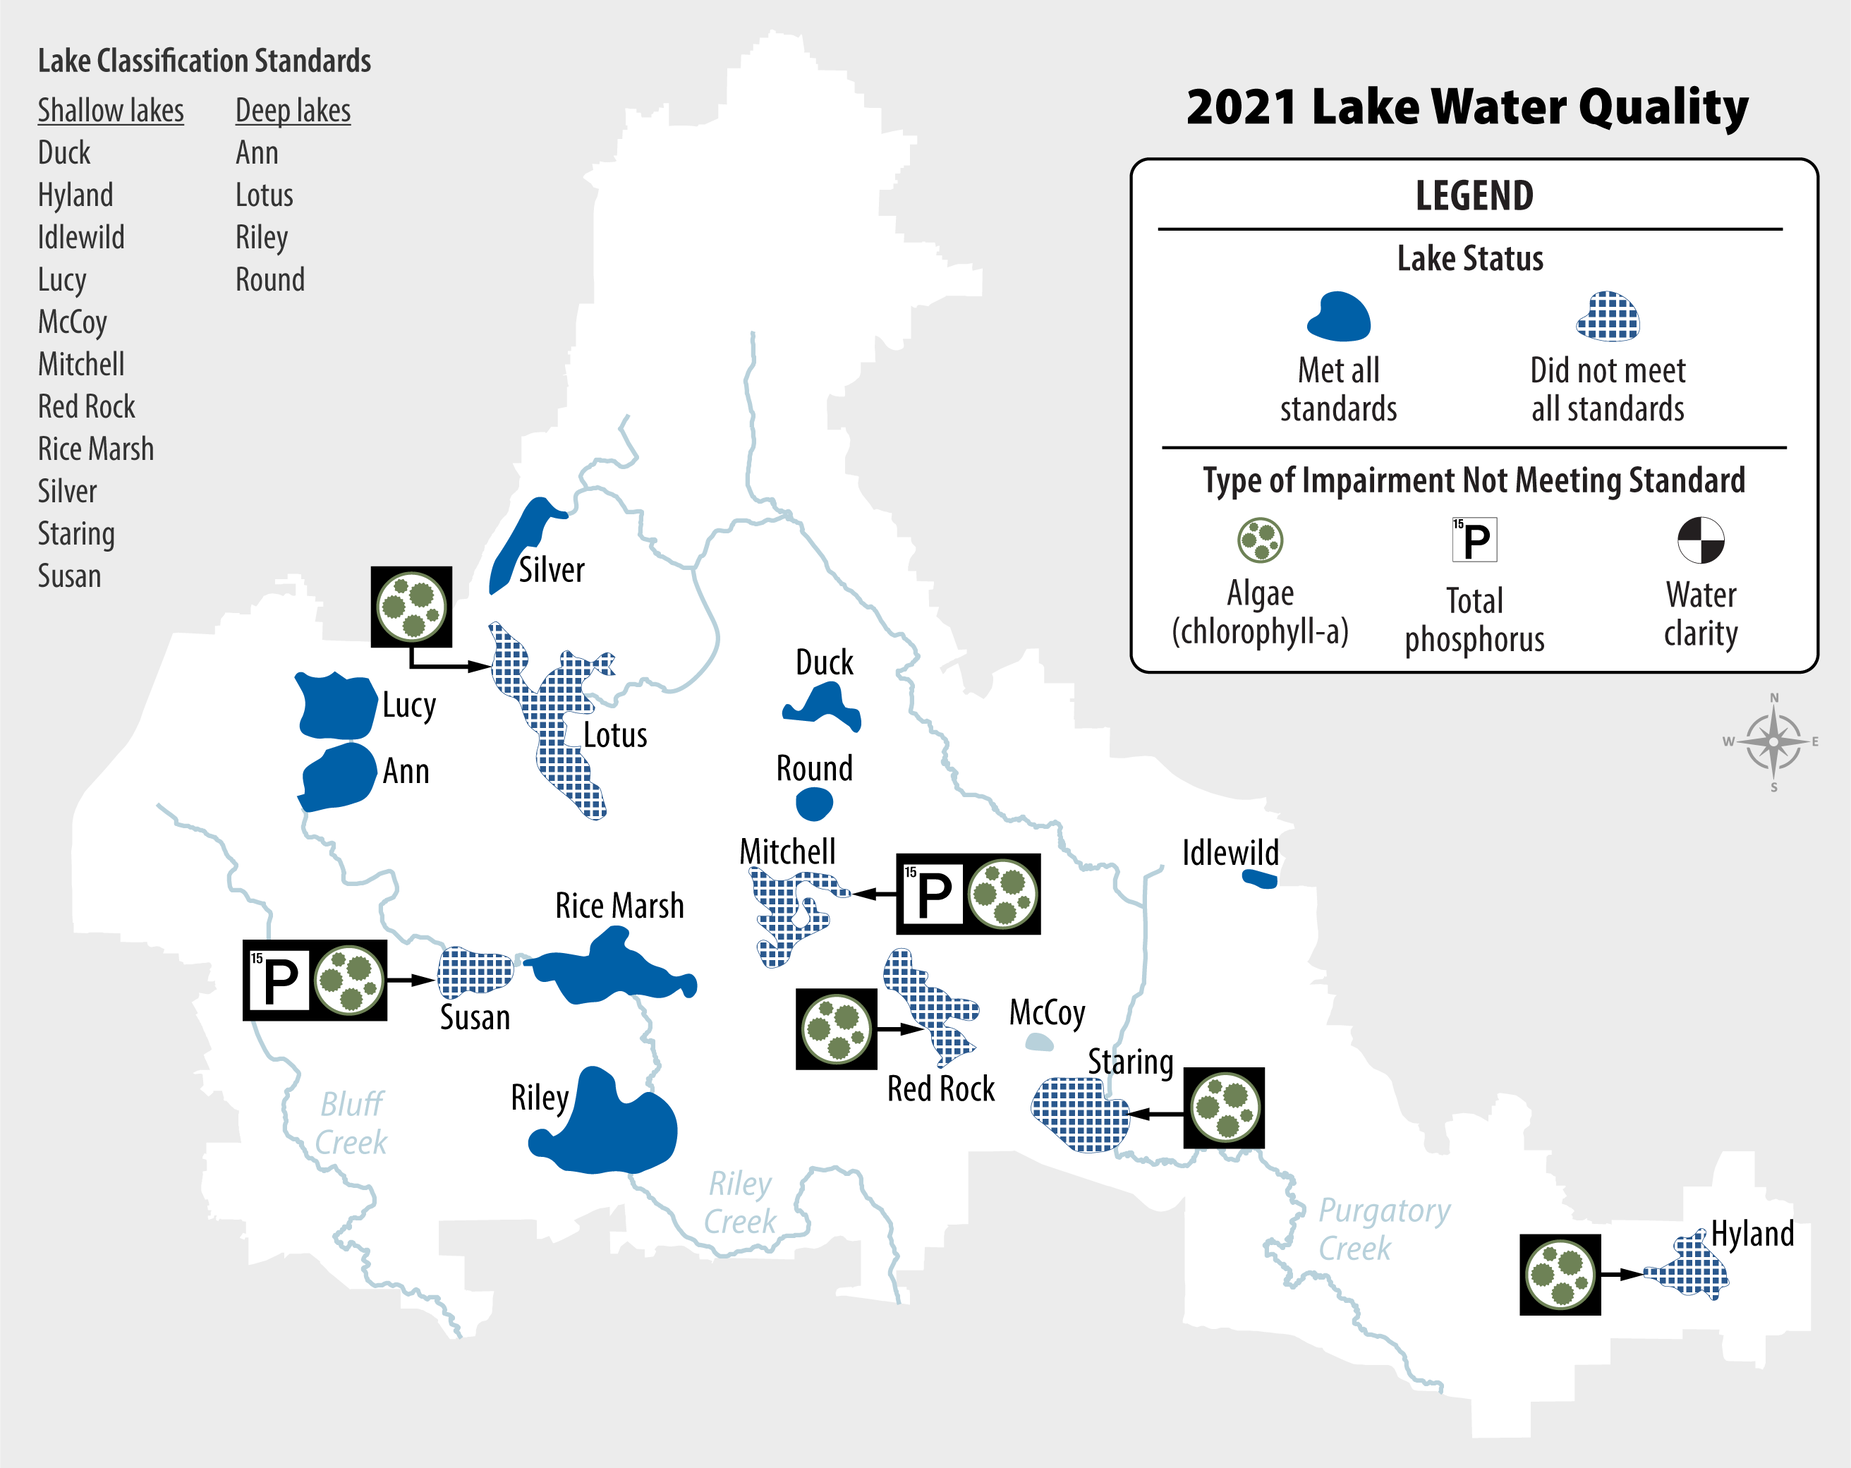
Summary of the lake water quality data collected in 2021 by the RPBCWD as compared to the Minnesota Pollution Control Agency Water Quality Standards. Chlorophyll-a, Total Phosphorus, and Secchi Disk depth during the growing season (June-September) for both ‘deep’ lakes or lakes >15 ft deep and < 80% littoral area and ‘shallow’ lakes or lakes 80% littoral area. The corresponding symbols next to each lake indicate which water quality standard was not met and lakes remaining blue met all standards.
2021 Stream Water Quality Summary
The summary for all three creeks is based on water quality parameters developed by the MPCA in 2014 for Eutrophication and TSS as well as impairment status for fish and macroinvertebrates. The parameters measured from April to September and the associated MPCA water quality limits for streams located in the Central River Region include Dissolved Oxygen (DO) daily minimum > 4 mg/L, summer season average TP < 0.1 mg/L, TSS < 10% exceedance of 30 mg/L limit during the summer season, summer season average Chl-a <18 ug/L, and summer season average pH < 9 su and >6 su (MPCA, 2016).
Overall, stream water quality remained relatively the same across the District. The number of water quality standard impairments overall increased slightly from 2020 to 2021; Bluff had nine (previously ten), Riley had eleven (previously five), and Purgatory had nine (previously eleven). No regular creek sampling sites met all MPCA water quality standards assessed in 2021, down from two sites in 2020 (R5 and R3). Like previous years, TP was the water quality standard causing the most impairments in 2021 with 11 of the 18 sites not meeting the standard. TSS impairments were slightly reduced from 2020. Five (previously six) sites were impaired. Riley Creek surpassed Bluff Creek as the stream with the most impaired water quality sites in 2021. Prior to 2021, Bluff Creek generally had the most impairments. Riley was also the most degraded from 2020. Impairments on Riley Creek were relatively similar compared to 2020, however DO was impaired across three sites compared to zero in 2020. This was most likely attributed to the low water levels and lack of precipitation. The extremely low flows seen in 2021 led to reduced oxygen levels and concentrated nutrients in the stream. These factors combined led to the increase in impairments. This is also what likely caused chloride concentrations to be above the MPCA chloride standard at B4 and R4 in May, June, and July. Both of these sites are downstream of Highway 5 which receives significant salt application in the winter. All sites met the pH and Chl-a water quality limits in 2021. MPCA macroinvertebrate impairments included lower reaches of Riley and Purgatory Creek. Lower reaches of Riley and Bluff Creek had fish impairments.
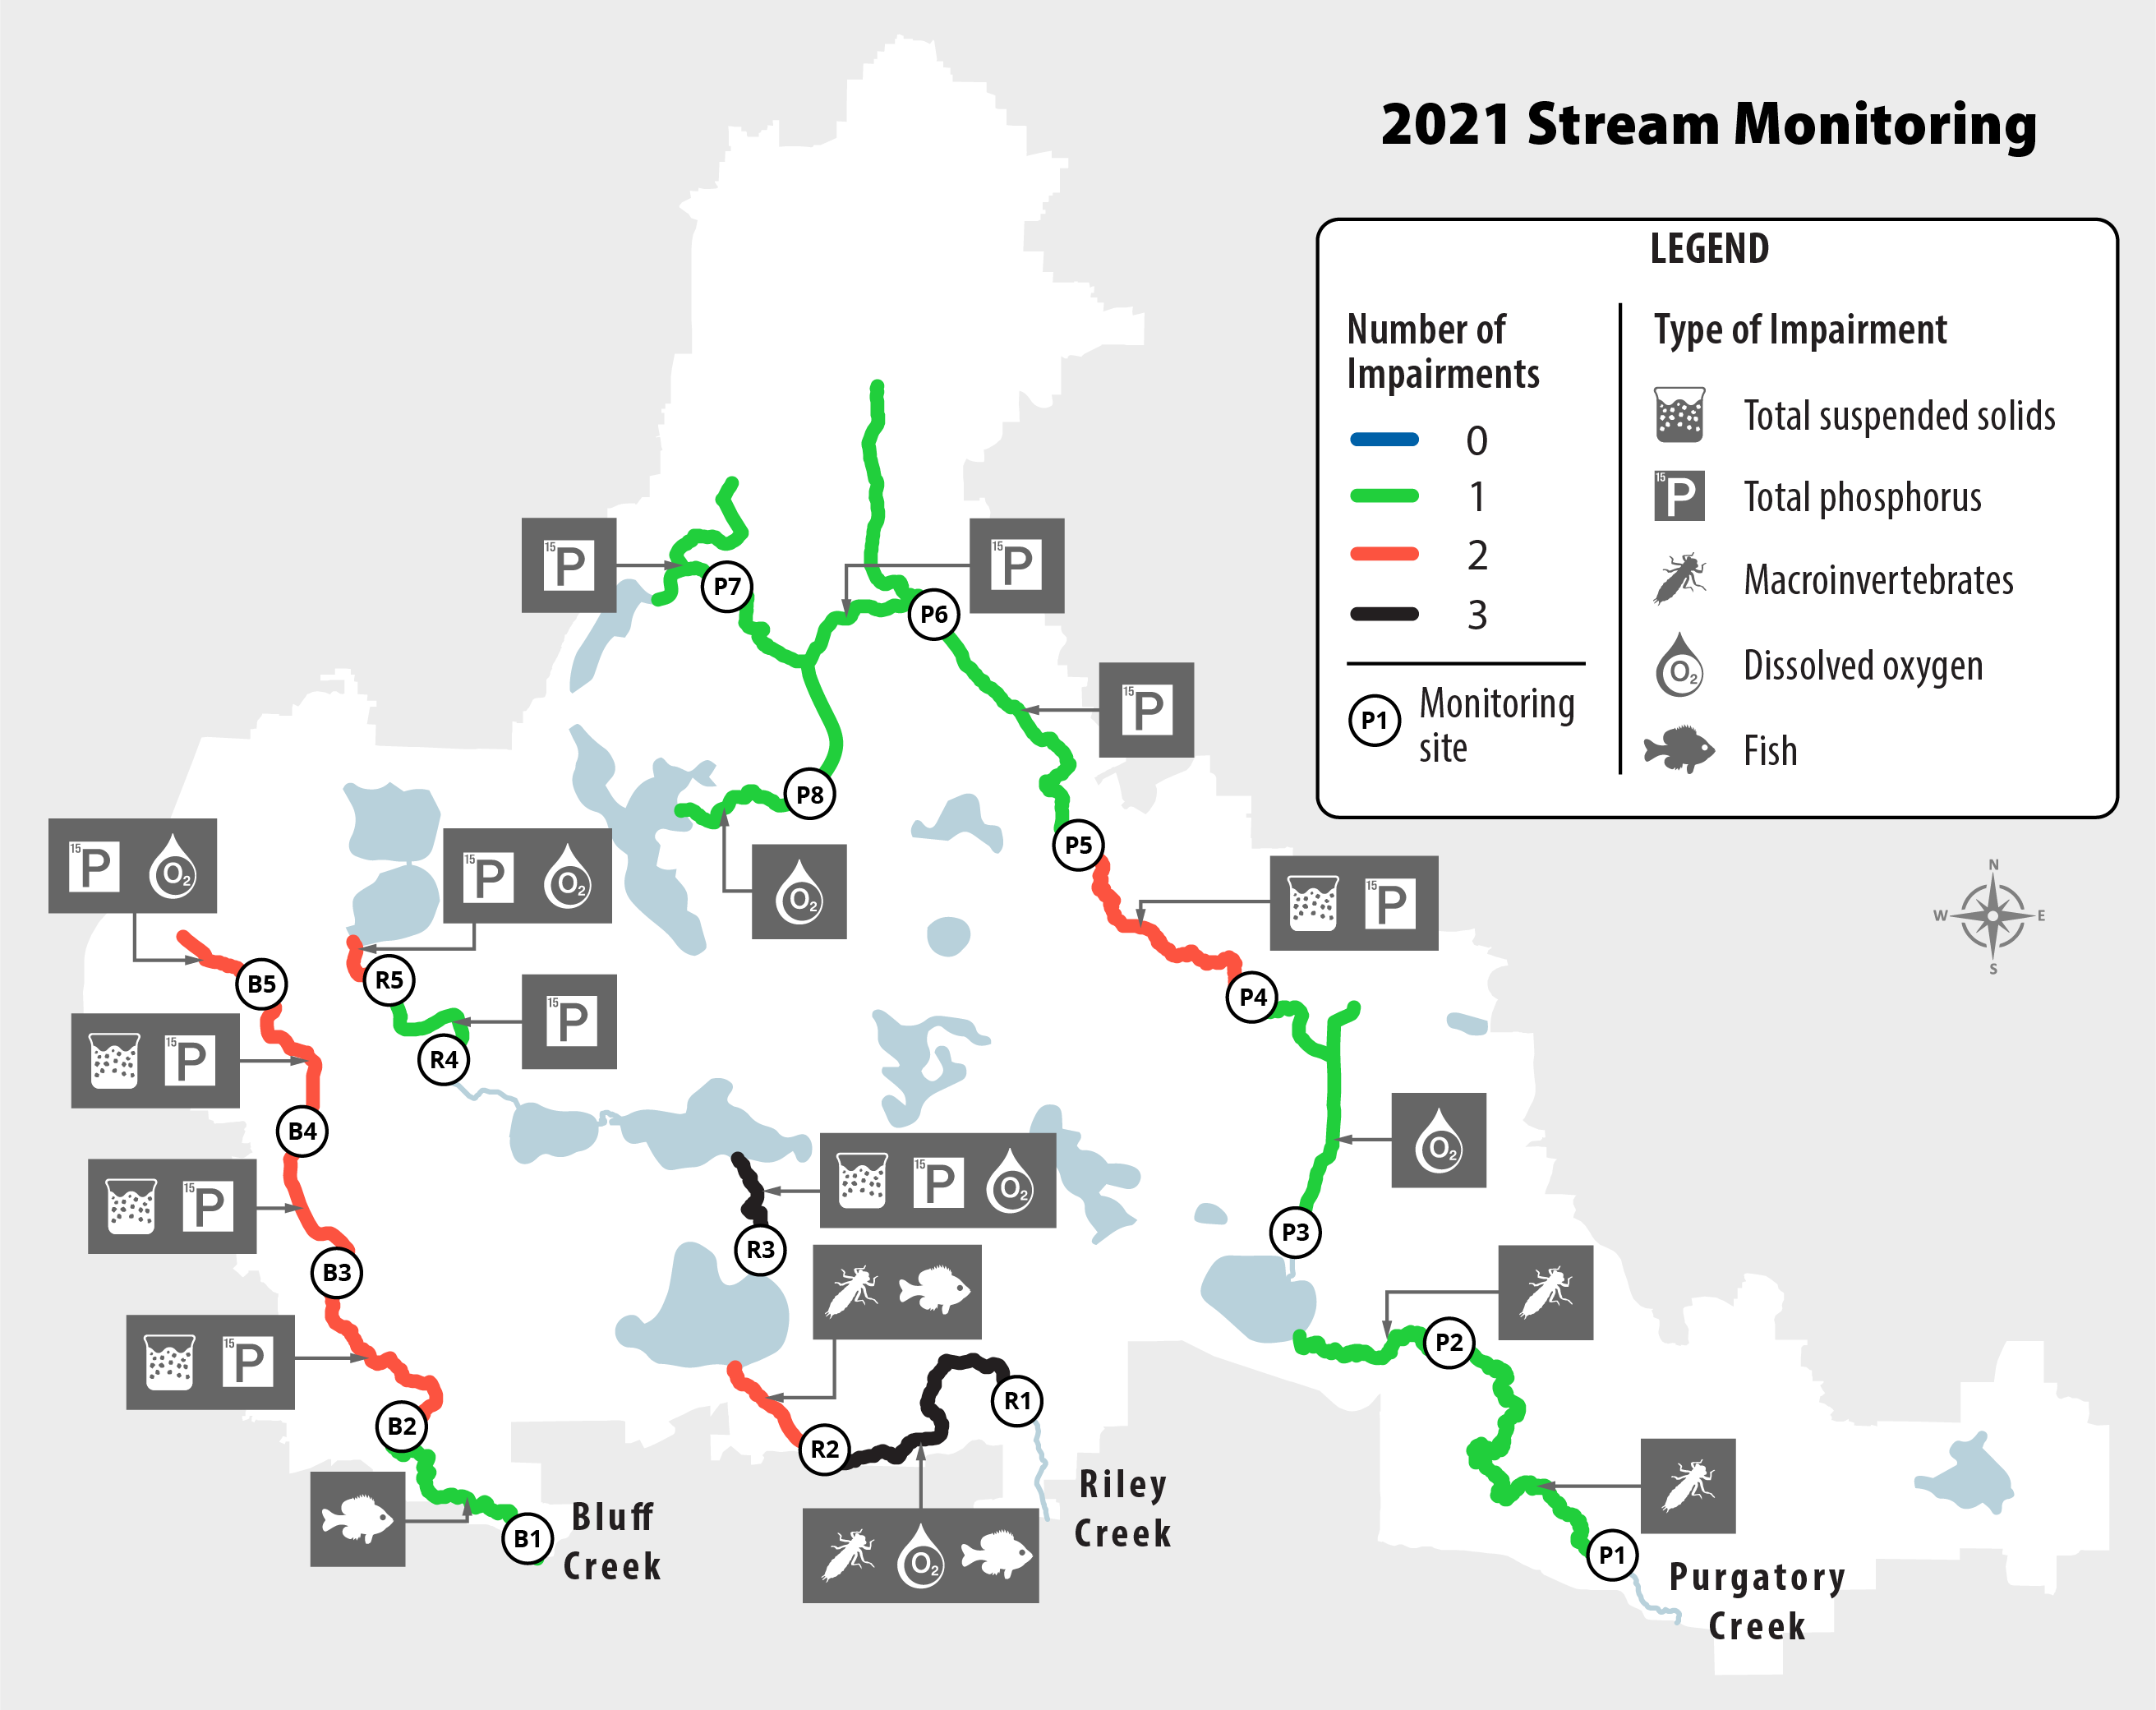
2021 stream water quality data from Bluff Creek, Riley Creek, and Purgatory Creek in 2021 by the Riley Purgatory Bluff Creek Watershed District as compared to the Minnesota Pollution Control Agency (MPCA) Water Quality Standards. Eighteen water monitoring locations (white circles) were sampled every other week and data from the individual sites were applied upstream to the next monitoring location. The summer season (April-September) eutrophication and total suspended solids water quality standards used in this assessment included: Dissolved Oxygen (DO) daily minimum > 4 mg/L, average Total Phosphorus (TP) < 0.1 mg/L, Total Suspended Solids (TSS) < 10% exceedance of 30 mg/L limit, average Chlorophyll-a (CHLA) <18 ug/L, average pH < 9 su and > 6 su. The corresponding labels next to each stream section indicate which water quality standards were not met.
Want to learn more?
Read the full 2021 Water Resources Report!