Shoreland Health Evaluation
Introduction
The water quality and overall health of a lake is determined by multiple factors. A major factor is the condition of the shoreland surrounding a lake. Shoreland impacts lake health in multiple ways:
- The amount of shoreland area covered by hard surfaces (roofs, driveways, etc.) and turfgrass impacts the amount of stormwater runoff (and pollutants it carries) that enters a lake.
- The presence of vegetated buffers, rain gardens, and trees help capture and filter stormwater runoff.
- Aquatic and shoreline vegetation dissipates wave energy, minimizing shoreline erosion and scouring of lake beds.
- Canopy trees provide shade and help reduce water temperatures, making the water more hospitable to aquatic organisms and less likely to have algal blooms.
- Emergent aquatic plants (e.g. bulrushes) protect shorelines by acting as wave breaks and provide important habitat for aquatic animals.
- Exposed soils erode and decrease the water clarity of lakes and impact fish spawning beds.
- Yard maintenance including handling of yard waste and lawn chemicals can be a source of pollution.
Shoreland is a transition zone between upland areas and the lake. A diverse variety of wildlife use shoreland for food, water, shelter, and a place to raise young. Natural shoreland with vegetation serves as a buffer for the lake, protecting it from stormwater runoff carrying pollution.
What pollutes a lake? Nutrients, chemicals, eroded soil, bacteria, and debris are all groups of water pollution. The major sources of pollution include yard chemicals such as fertilizers and herbicides, exposed soils, winter de-icing products, dog droppings, and grass clippings and other yard waste .
To evaluate shoreland health, RPBCWD staff implemented a shoreland health evaluation. The work was completed in 2023 and included 11 lakes (Ann, Duck, Hyland, Lotus, Lucy, Mitchell, Red Rock, Riley, Silver, Staring, and Susan). The shoreland evaluations were visual inspections performed by staff in boats on the water following a slightly modified version of Score The Shore methods developed by the DNR.
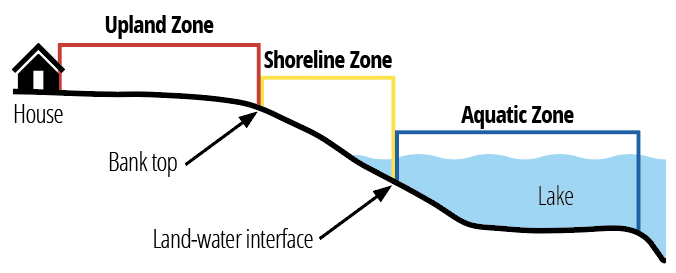
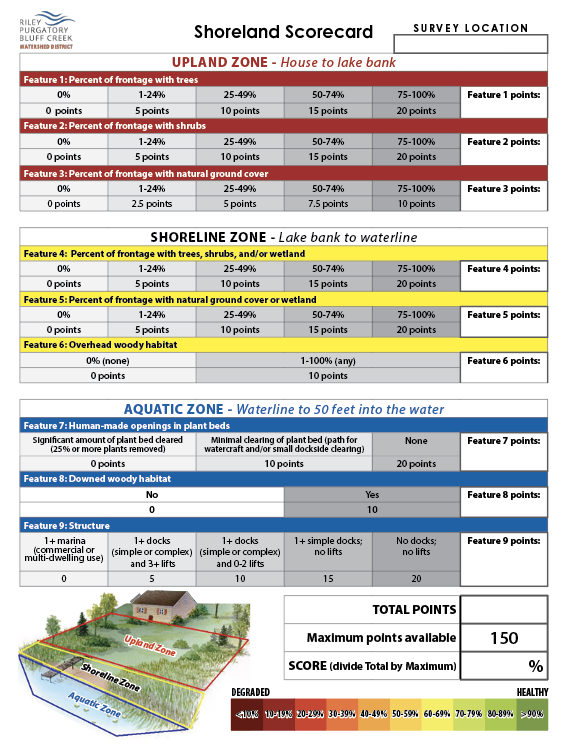
Score The Shore is a protocol developed by the DNR to rapidly assess the quantity and integrity of lakeshore habitat and to track changes over time. Nine features are scored in three different shoreland zones: upland, shoreline, and aquatic. More detail about features and scoring are in the shoreland scorecard.
Frequently Asked Questions
DNR staff use a tool called Score The Shore (STS) as a relatively non-labor intensive method to assess overall shoreland health for a lake. Some but not all lakes within RPBCWD have been evaluated by the DNR. RPBCWD staff decided to use the STS tool with some modification tailored to the area's geomorphology to evaluate all district lakes for both overall health (to compare to the DNR results) as well as at a finer scale (by property line) to use as an educational tool for homeowners.
During shoreland assessment, staff scored features within the upland zone, shoreline zone, and aquatic zone. The points from all zones were total and divided by 150 (the maximum points possible) to provide a percent score (0-100%).
| Zone | Features assessed | Maximum points |
|
Upland (house to top of bank) |
Tree cover |
20 |
|
Shrub cover |
20 | |
| Natural ground cover | 10 | |
|
Shoreline (top of bank to waterline) |
Tree/shrub/wetland cover |
20 |
| Natural ground cover | 20 | |
| Overhead woody habitat | 10 | |
|
Aquatic (waterline to 50-ft into water) |
Aquatic plant disturbance |
20 |
| Downed woody habita | 10 | |
| Structure (dock type) | 20 | |
| Total points possible | 150 | |
View the shoreland scorecard for details on features and how points were assigned.
RPBCWD plans to repeat shoreland health evaluations for lakes on about a five-year rotation. This will allow us to track a lake's average shoreland health over time. Because staff use property lines to establish survey points, property owners will also be able to track their individual score if they like.
RPBCWD does not intend to force property owners to modify their shoreland in any way based upon the scores. Shoreland health scores are being provided to the public through the interactive webmap. User may enter their address to find their property but scores are not tied directly to anyone's name or address. Our hope is that providing scores will encourage people to consider how they might make improvements to their shoreland to improve lake health.
Check out these ideas for improving your score by zone.
Upland and Shoreline Zones
- Stop mowing before you reach the shoreline. This action is easy - simply leave an unmown buffer of at least five feet along your shoreline. Better yet, install a native plant buffer. RPBCWD has grant funds available to help. Bonus: the tall vegetation will deter geese from hanging out in your yard.
- Plant native trees and shrubs in your yard. As they grow, they provide privacy from the neighbors, shady spots to hang out, and habitat for wildlife. Tree branches that hang over the water provide shade and habitat for aquatic life.
- Replace turfgrass with native plants. Once established, native plants require less maintenance than turfgrass while providing attractive blooms and habitat for butterflies and birds.
- Reconsider your beach. Sand beaches are not natural to lakes in our area and difficult to maintain. Reduce the size of the beach or consider an alternative. As you plan your waterfront, consider what portion is needed for lake access and recreation and where some of the above practices can be implemented.
Aquatic Zone
- Protect aquatic plants. Native aquatic plants are vital to lake health and removal is regulated by the DNR. Remove only what you need for open water access or a small swimming area. Learn about DNR aquatic plant regulations and permits. Before you get a permit, check with RPBCWD to see if any aquatic invasive plant treatments are planned for your lake (rpbcwd.org/AIScontrol).
- Leave woody debris. If a tree falls into the water or a branch floats to shore, let it be so that it can provide habitat for wildlife such as turtles, ducks, wading birds, and aquatic insects such as dragonfly larvae. If needed, push woody debris off to the side so it doesn't block your access to the lake.
- Keep it simple when adding or replacing a dock. A smaller dock means less disturbance to aquatic habitat. Also, there are regulations that limit the size of docks.
![]()
![]()
![]()
Natural shoreland restorations, native plant buffers, and similar projects may be
eligible for funds through our Stewardship Grant Program!
Are you going to make me modify my shoreland?
No. The individual shoreland scores are provided for educational purposes only. The scores will not be used by RPBCWD to force people to modify their shoreland.
Interactive Map of Shoreland Scores
Interpreting your score
Contents of score window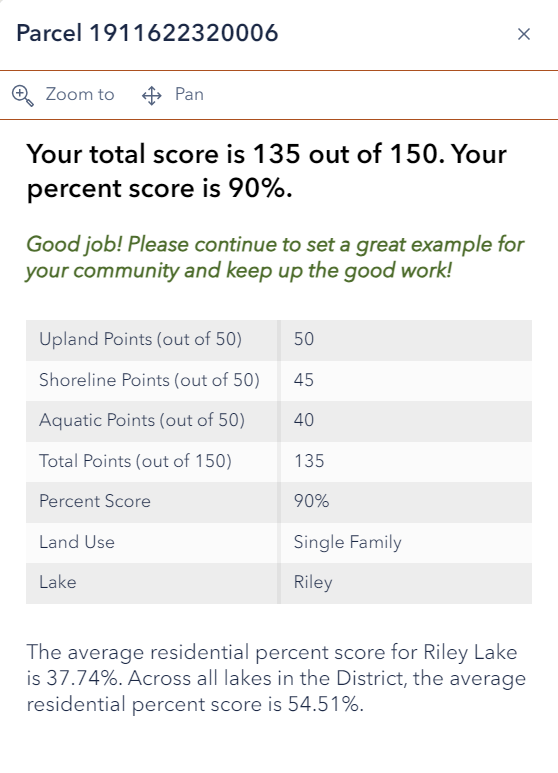
Use the search tool (magnifying glass icon) to enter your address and focus the map to your property. Look for the color line (green, yellow, orange or red) along your shore. Click on the line and a window will pop up (see example on right) listing the county property number with details about the score including:
- Upland Zone score (out of 50 points)
- Shoreline Zone score (out of 50 points)
- Aquatic Zone score (out of 50 points)
- Total score (total of points)
- Percent score (total score in points divided by 150, which is the maximum)
The window will also tell you what the average residential percent score is for the lake and for all lakes across the watershed district.
Factors that may impact scores
The scores were assessed by district staff from a boat on the water. Factors that may have affected score include:
- Subjectivity of observer
- Abundance of trees along shore may have obscured view of upland zone
- Poor water clarity or glare may have reduced ability to see plant beds and woody debris
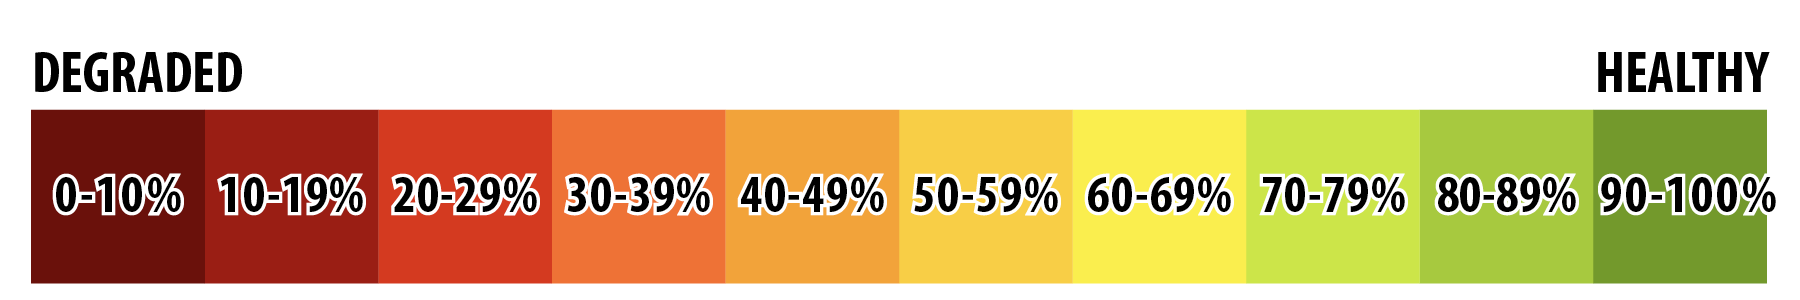
Your score in context
Shoreland percent score ranges from 0% (totally degraded/dark red) to 100% (perfectly healthy/dark green). No residential property score received a perfect score, and we did not expect developed lake shoreland to have perfect scores. In fact, the average score for all residential properties across all district lakes was 54.51%.
Our goal in providing individual shoreland scores is to educate property owners about the impact their property has on lake health and to inspire action to improve scores. For those interested improving the health of their shoreland, RPBCWD offers generous cost-share grants to help.
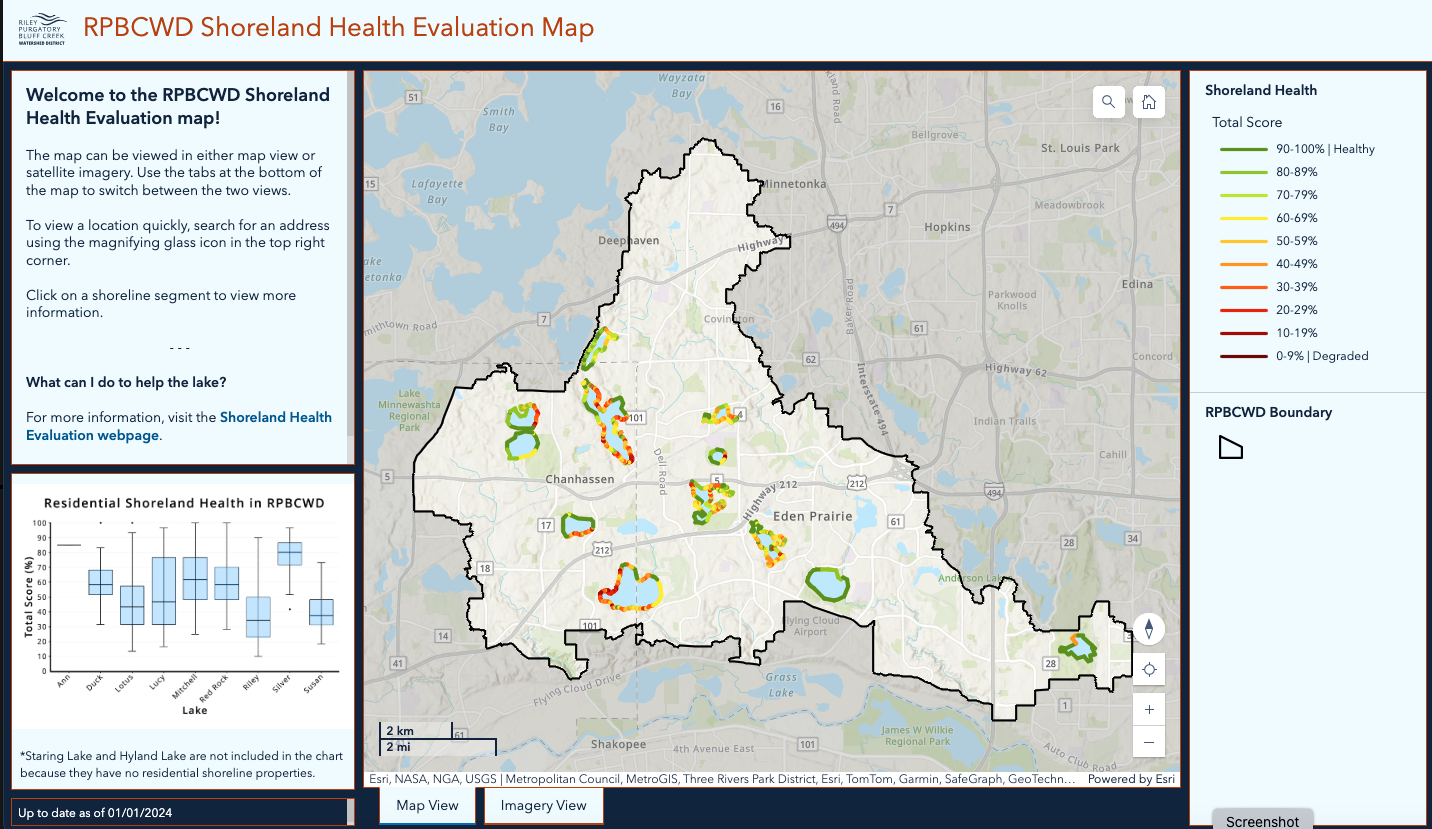
View the map
Click the image below to open the Shoreland Health Evaluation Map. You can also open the map directly in a new window.
Other ways to protect lake health
Prevent water pollution at its source by taking these actions.
- Eliminate or reduce use of lawn chemicals. These products may have unintended consequences in a lake, causing an algae bloom or poisoning fish.
- Clean up dog waste. As it degrades, it releases nutrients and bacteria that can end up in the lake.
- Sweep up grass clippings from your driveway and street. Rain washes whatever is on these surfaces into a stormdrain which empties into the lake or nearby pond.
- Use permeable materials when possible. Permeable pavers, gravel, and other options work as well as concrete for a patio but allow infiltration of water into the ground instead of creating runoff.
Score Your Own Shore
Try your hand at scoring your own shoreland using the scorecard below. Instructions are provided too. Note that that shoreland assessment does not differentiate between native and invasive plants.
Related topics
- Lake resident information
- Stewardship Grant program
- Native plant resources
- Shoreline permit information
- Water quality monitoring
- Find-your-watershed map
Resources
- Minnesota Lake Plant Survey Manual (description of Score The Shore is in Chapter 2)
- DNR Score Your Shore: A citizen shoreline description survey with guidebook
- DNR Restore Your Shore: A tool for shoreland owners and professionals for implementing shoreland restoration projects
Find out if you need a permit to do shoreline work.